15 Locks on Memory Structures
PostgreSQL 14 · Translated from Russian by Liudmila Mantrova · Chinese translation by Xiong Cancan
15.1 Spinlocks
To protect data structures in shared memory, PostgreSQL uses several types of lighter and less expensive locks rather than regular heavyweight ones.
The simplest locks are  spinlocks. They are usually acquired for a very short time interval (no longer than several CPU cycles) to protect particular memory cells from concurrent updates.
Spinlocks are based on atomic CPU instructions, such as compare-and-swap.1 They only support the exclusive locking mode. If the required resource is already locked, the process busy-waits, repeating the command (it “spins” in the loop, hence the name). If the lock cannot be acquired within the specified time interval, the process pauses for a while and then starts another loop.
This strategy makes sense if the probability of a conflict is estimated as very low, so after an unsuccessful attempt the lock is likely to be acquired within several instructions.
Spinlocks have neither deadlock detection nor instrumentation. From the practical standpoint, we should simply know about their existence; the whole responsibility for their correct implementation lies with PostgreSQL developers.
15.2 Lightweight Locks
Next, there are so-called  lightweight locks, or lwlocks.2 Acquired for the time needed to process a data structure (for example, a hash table or a list of pointers), lightweight locks are typically short; however, they can take longer when used to protect I/O operations.
Lightweight locks support two modes: exclusive (for data modification) and shared (for read-only operations). There is no queue as such: if several processes are waiting on a lock, one of them will get access to the resource in a more or less random fashion. In high-load systems with multiple concurrent processes, it can lead to some unpleasant effects.
Deadlock checks are not provided; we have to trust PostgreSQL developers that lightweight locks are implemented correctly. However, these locks do have instrumentation, so, unlike spinlocks, they can be observed.
15.3 Examples
To get some idea of how and where spinlocks and lightweight locks can be used, let’s take a look at two shared memory structures: buffer cache and WAL buffers. I will name only some of the locks; the full picture is too complex and is likely to interest only PostgreSQL core developers.
Buffer Cache
To access a hash table used to locate a particular buffer in the cache, the process must acquire a 
BufferMapping lightweight lock either in the shared mode for reading or in the exclusive mode if any modifications are expected. (p. 147)
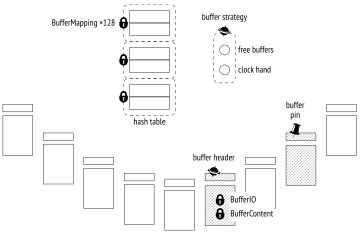
The hash table is accessed very frequently, so this lock often becomes a bottleneck. To maximize granularity, it is structured as a tranche of 128 individual lightweight locks, each protecting a separate part of the hash table.3
A hash table lock was converted into a tranche of 16 locks as early as 2006, in PostgreSQL 8.2; ten years later, when version 9.5 was released, the size of the tranche was increased to 128, but it may still be not enough for modern multi-core systems.
To get access to the buffer header, the process acquires a 
buffer header spinlock4 (the name is arbitrary, as spinlocks have no user-visible names). Some operations, such as incrementing the usage counter, do not require explicit locks and can be performed using atomic CPU instructions.
To read a page in a buffer, the process acquires a 
BufferContent lock in the header of this buffer.5 It is usually held only while tuple pointers are being read; later on, the protection provided by  buffer pinning will be enough. If the buffer content has to be modified, the
BufferContent lock must be acquired in the exclusive mode. (p. 148)
When a buffer is read from disk (or written to disk), PostgreSQL also acquires a 
BufferIO lock in the buffer header; it is virtually an attribute used as a lock rather than an actual lock.6 It signals other processes requesting access to this page that they have to wait until the I/O operation is complete.
The pointer to free buffers and the clock hand of the eviction mechanism are protected by a single common 
buffer strategy spinlock.7
WAL Buffers
WAL cache also uses a hash table to map pages to buffers. Unlike the buffer cache hash table, it is protected by a single 
WALBufMapping lightweight lock because WAL cache is smaller (it usually takes of the buffer cache size) and buffer access is more ordered.8
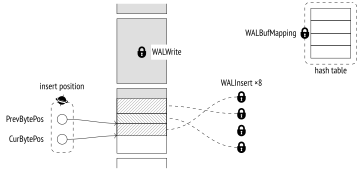
Writing of WAL pages to disk is protected by a 
WALWrite lightweight lock, which ensures that this operation is performed by one process at a time.
To create a WAL entry, the process first reserves some space within the WAL page and then fills it with data. Space reservation is strictly ordered; the process must acquire an 
insert position spinlock that protects the insertion pointer.9 But once the space is reserved, it can be filled by several concurrent processes. For this purpose, each process must acquire any of the eight lightweight locks constituting the 
WALInsert tranche.10
15.4 Monitoring Waits
Without doubt, locks are indispensable for correct PostgreSQL operation, but they can lead to undesirable waits. It is useful to track such waits to understand their origin.
The easiest way to get an overview of long-term locks is to turn the log_lock_waits parameter on; it enables extensive logging of all the locks that cause a transaction to wait for more than deadlock_timeout. This data is displayed when a deadlock check completes, hence the parameter name. (default: off) (default: 1s) (p. 225)
However, the pg_stat_activity view provides much more useful and complete information. Whenever a process—either a system process or a backend—cannot proceed with its task because it is waiting for something, this wait is reflected in the wait_event_type and wait_event fields, which show the type and name of the wait, respectively. (v. 9.6)
All waits can be classified as follows.11
Waits on various locks constitute quite a large group:
Lock — heavyweight locks
LWLock — lightweight locks
BufferPin — pinned buffers
But processes can be waiting for other events too:
IO — input/output, when it is required to read or write some data
Client — data sent by the client (psql spends in this state most of the time)
IPC — data sent by another process
Extension — a specific event registered by an extension
Sometimes a process simply does not perform any useful work. Such waits are usually “normal,” meaning that they do not indicate any issues. This group comprises the following waits:
Activity — background processes in their main cycle
Timeout — timer
Locks of each wait type are further classified by wait names. For example, waits on lightweight locks get the name of the lock or the corresponding tranche.12
You should bear in mind that the pg_stat_activity view displays only those waits that are handled in the source code in an appropriate way.13 Unless the name of the wait appears in this view, the process is not in the state of wait of any known type. Such time should be considered unaccounted for; it does not necessarily mean that the process is not waiting on anything—we simply do not know what is happening at the moment.
Here all the background processes were idle when the view was sampled, while the client backend was busy executing the query and was not waiting on anything.
15.5 Sampling
Unfortunately, the pg_stat_activity view shows only the current information on waits; statistics are not accumulated. The only way to collect wait data over time is to sample the view at regular intervals.
We have to take into account the stochastic nature of sampling. The shorter the wait as compared to the sampling interval, the lower the chance to detect this wait. Thus, longer sampling intervals require more samples to reflect the actual state of things (but as you increase the sampling rate, the overhead also rises). For the same reason, sampling is virtually useless for analyzing short-lived sessions.
PostgreSQL provides no built-in tools for sampling; however, we can still try it out using the pg_wait_sampling14 extension. To do so, we have to specify its library in the shared_preload_libraries parameter and restart the server:
Now let’s install the extension into the database:
This extension can display the history of waits, which is saved in its ring buffer. However, it is much more interesting to get the waiting profile—the accumulated statistics for the whole duration of the session.
For example, let’s take a look at the waits during benchmarking. We have to start the pgbench utility and determine its process ID while it is running:
Once the test is complete, the waits profile will look as follows:
By default (set by the pg_wait_sampling.profile_period parameter) samples are taken 100 times per second. So to estimate the duration of waits in seconds, you have to divide the count value by 100. (default: 10ms)
In this particular case, most of the waits are related to flushing WAL entries to disk. It is a good illustration of the unaccounted-for wait time: the WALSync event was not instrumented until PostgreSQL 12; for lower versions, a waits profile would not contain the first row, although the wait itself would still be there. (v. 12)
And here is how the profile will look like if we artificially slow down the file system for each I/O operation to take 0.1 seconds (I use slowfs15 for this purpose):
Now I/O operations are the slowest ones—mainly those that are related to writing WAL files to disk in the synchronous mode. Since WAL writing is protected by a WALWrite lightweight lock, the corresponding row also appears in the profile.
Clearly, the same lock is acquired in the previous example too, but since the wait is shorter than the sampling interval, it either is sampled very few times or does not make it into the profile at all. It illustrates once again that to analyze short waits you have to sample them for quite a long time.
backend/storage/buffer/bufmgr.c include/storage/buf_internals.h, BufMappingPartitionLock function ↩︎
backend/storage/buffer/bufmgr.c, LockBufHdr function ↩︎
backend/storage/buffer/bufmgr.c, StartBufferIO function ↩︎
backend/access/transam/xlog.c, AdvanceXLInsertBuffer function ↩︎
backend/access/transam/xlog.c, ReserveXLogInsertLocation function ↩︎
backend/access/transam/xlog.c, WALInsertLockAcquire function ↩︎
postgresql.org/docs/14/monitoring-stats.html#WAIT-EVENT-TABLE ↩︎
postgresql.org/docs/14/monitoring-stats.html#WAIT-EVENT-LWLOCK-TABLE ↩︎